Demographics and diversity of the social work register
Data as at 31 March 2026
Total number of social workers on the register

As at 31 March 2026 there were 106,521 social workers on our register.
Social work is a regulated profession. This means that to be able to practise as a social worker in England, individuals must be registered with Social Work England, it does not mean that they are currently practicing.
Diversity of social workers at 31 March 2026
When joining the register or renewing their registration, social workers are asked to provide their diversity data. This information helps us build a more accurate and detailed picture of the social work profession and supports us to meet our responsibilities under the public sector equality duty. Collecting and analysing diversity data enables us to meet these duties meaningfully. It helps us monitor trends, identify where action may be needed, and ensure that our regulatory processes are fair, inclusive and proportionate for everyone in the profession.
The data we collect includes details about their sex at birth, disability, ethnicity, religion, sexual orientation and gender reassignment. Providing this data is optional and does not represent the whole register, but it plays an important role in helping us understand the profession and how our processes affect different groups.
As of 31 March 2026, 93% of registered social workers had answered all 6 diversity questions and 97% had answered at least one question.
Percentage of social workers who have and have not provided diversity data
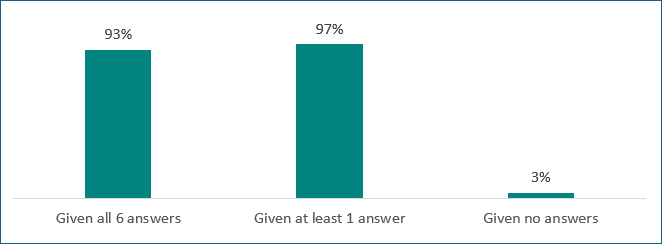
At 31 March 2026:
- 93% have given all 6 answers
- 97% have given at least 1 answer
- 3% have given no answers
Age of social workers at 31 March 2026
When joining the register or renewing their registration, social workers are asked to provide their age in accordance with our registration rules. As such, we hold data for the age for all social workers on the register.
Number of social workers by age:

As at 31 March 2026:
- aged 24 or under: 2,193 (2%)
- aged 25 to 29: 8,186 (8%)
- aged 30 to 34: 11,930 (11%)
- aged 35 to 39: 14,798 (14%)
- aged 40 to 44: 15,119 (14%)
- aged 45 to 49: 14,269 (13%)
- aged 50 to 54: 13,098 (12%)
- aged 55 to 59: 12,486 (12%)
- aged 60 or over: 14,442 (14%)
Number of social workers by sex at birth

As at 31 March 2026:
- female: 82,732 (78%)
- male: 15,312 (14%)
- prefer not to say: 2,089 (2%)
- unknown: 6,388 (6%)
Number of social workers by disability
As defined under the Equality Act 2010, disability refers to whether a person has a physical or mental impairment that has a substantial and long-term negative effect on their ability to do normal daily activities.

As at 31 March 2026:
- yes: 12,093 (11%)
- no: 84,719 (80%)
- prefer not to say: 5,990 (6%)
- unknown: 3,719 (3%)
Number of social workers by ethnicity
| Ethnicity grouping | Number of social workers |
|---|---|
| Ethnicity grouping Bangladeshi | Number of social workers 691 (1%) |
| Ethnicity grouping Chinese | Number of social workers 319 (<1%) |
| Ethnicity grouping Indian | Number of social workers 3,241 (3%) |
| Ethnicity grouping Pakistani | Number of social workers 2,074 (2%) |
| Ethnicity grouping Any other Asian background | Number of social workers 744 (1%) |
| Ethnicity grouping African | Number of social workers 14,245 (13%) |
| Ethnicity grouping Caribbean | Number of social workers 4,417 (4%) |
| Ethnicity grouping Any other Black/African/Caribbean background | Number of social workers 1,162 (1%) |
| Ethnicity grouping White and Asian | Number of social workers 706 (1%) |
| Ethnicity grouping White and Black African | Number of social workers 715 (1%) |
| Ethnicity grouping White and Black Caribbean | Number of social workers 1,513 (1%) |
| Ethnicity grouping Any other Mixed/Multiple ethnic background | Number of social workers 963 (1%) |
| Ethnicity grouping Arab | Number of social workers 88 (<1%) |
| Ethnicity grouping Any other ethnic group | Number of social workers 467 (<1%) |
| Ethnicity grouping White - English/Welsh/Scottish/Northern Irish/British | Number of social workers 62,738 (59%) |
| Ethnicity grouping White - Gypsy or Irish Traveller | Number of social workers 66 (<1%) |
| Ethnicity grouping White - Irish | Number of social workers 1,325 (1%) |
| Ethnicity grouping Any other White background | Number of social workers 4,533 (4%) |
| Ethnicity grouping Prefer not to say | Number of social workers 2,456 (2%) |
| Ethnicity grouping Unknown | Number of social workers 4,058 (4%) |
Number of social workers by religion

As at 31 March 2026:
- Buddhism: 684 (1%)
- Christianity: 45,674 (43%)
- Hinduism: 874 (1%)
- Islam: 4,459 (4%)
- Judaism: 410 (<1%)
- none: 40,070 (38%)
- other: 2,084 (2%)
- prefer not to say: 7,494 (7%)
- Sikhism: 861 (1%)
- unknown: 3,911 (4%)
Number of social workers by sexual orientation

As at 31 March 2026:
- bisexual: 2,506 (2%)
- gay man: 1,337 (1%)
- gay woman: 2,078 (2%)
- heterosexual: 87,762 (82%)
- prefer to self describe: 574 (1%)
- prefer not to say: 8,352 (8%)
- unknown: 3,912 (4%)
Number of social workers with the protected characteristic of gender reassignment:

As at 31 March 2026:
- yes: 242 (<1%)
- no: 96,602 (91%)
- don't know: 284 (<1%)
- prefer not to say: 3,303 (3%)
- unknown: 6,090 (6%)
Nationality of social workers at 31 March 2026
When joining the register or renewing their registration, social workers are asked to provide their nationality, region and the sector that they work in. Nationality refers to their country of citizenship and should not be confused with national identity, or where they earned their social work qualification.
Top 10 most common nationalities of social workers
There are 124 different nationalities represented on the register. At the end of March 2026 there were 94,675 British social workers register, 89% of the total number. Other than British, the top 10 most common nationalities on the register were:
- American: 385
- German: 323
- Indian: 844
- Irish: 1,022
- Nigerian: 1,077
- Polish: 408
- Portuguese: 301
- Romanian: 340
- South African: 715
- Zimbabwean: 2,947
Region and sector type of social workers at 31 March 2026
Number of social workers by region
This information has been derived from employer postcodes. Employment information is not a mandatory requirement during registration and only includes employment relevant to social work practice, as such we do not have data for all registrants

As at 31 March 2026:
- Midlands: 16,279 (15%)
- Eastern: 8,738 (8%)
- London: 16,137 (15%)
- North East: 4,969 (5%)
- North West: 14,025 (13%)
- South East: 12,788 (12%)
- South West: 8,349 (8%)
- Yorkshire and the Humber: 9,684 (9%)
- rest of UK: 633 (1%)
- unknown: 14,919 (14%)
Area of social work practice
This information is derived from employer information. Employment information is not a mandatory requirement during registration. As such, we do not have employment information and/or the sector type for all social workers.
| Area of social work practice | Number of social workers |
|---|---|
| Area of social work practice Adult - hospital work | Number of social workers 3,162 (3%) |
| Area of social work practice Adult - learning disabilities | Number of social workers 3,686 (3%) |
| Area of social work practice Adult - mental health | Number of social workers 9,510 (9%) |
| Area of social work practice Adult - older people | Number of social workers 7,251 (7%) |
| Area of social work practice Adult - other | Number of social workers 10,057 (9%) |
| Area of social work practice Adult - physical disabilities | Number of social workers 898 (1%) |
| Area of social work practice Child in need and in protection | Number of social workers 21,324 (20%) |
| Area of social work practice Children and families - other | Number of social workers 15,802 (15%) |
| Area of social work practice Children with disabilities | Number of social workers 2,618 (2%) |
| Area of social work practice Children's hospital social work | Number of social workers 181 (<1%) |
| Area of social work practice Children's mental health | Number of social workers 2,418 (2%) |
| Area of social work practice Court services/CAFCASS | Number of social workers 1,858 (2%) |
| Area of social work practice Criminal justice | Number of social workers 269 (<1%) |
| Area of social work practice Domestic abuse | Number of social workers 193 (<1%) |
| Area of social work practice Fostering, special guardianship and adoption, residential | Number of social workers 10,719 (10%) |
| Area of social work practice Leaving care post 18+ | Number of social workers 751 (1%) |
| Area of social work practice Lecturer or other academic | Number of social workers 1,242 (1%) |
| Area of social work practice Other specialist services | Number of social workers 4,979 (5%) |
| Area of social work practice Substance misuse | Number of social workers 282 (<1%) |
| Area of social work practice Unaccompanied asylum seekers and refugees | Number of social workers 554 (1%) |
| Area of social work practice Youth justice | Number of social workers 640 (1%) |
| Area of social work practice Unknown | Number of social workers 8,127 (8%) |
Data archive annual reports
As at 31 March 2024:
Total number of social workers on the register: 102,861
Number of social workers by age:
- aged 24 or under: 2,171
- aged 25 to 29: 8,436
- aged 30 to 34: 11,738
- aged 35 to 39: 14,334
- aged 40 to 44: 14,434
- aged 45 to 49: 12,790
- aged 50 to 54: 13,093
- aged 55 to 59: 12,549
- aged 60 or over: 13,316
Number of social workers by gender:
- female: 85,787
- male: 16,959
- prefer not to say: 65
- prefer to self describe: 50
Percentage of social workers who have and have not provided diversity data:
- 94% have given all 5 answers
- 95% have given at least 1 answer
- 5% have given no answers
Number of social workers by disability:
- yes: 9,315
- no: 83,535
- prefer not to say: 4,844
- unknown: 5,167
Number of social workers by ethnicity:
- African: 11,623
- Any other Asian background: 633
- Any other Black/African/Caribbean background: 965
- Any other ethnic group: 458
- Any other Mixed/Multiple ethnic background: 840
- Any other White background: 4,420
- Arab: 78
- Bangladeshi: 602
- Caribbean: 4,206
- Chinese: 275
- English/Welsh/Scottish/Northern Irish/British: 62,016
- Gypsy or Irish Traveller: 65
- Indian: 2,935
- Irish: 1,330
- Pakistani: 1,833
- Prefer not to say: 2,157
- White and Asian: 660
- White and Black African: 705
- White and Black Caribbean: 1,420
- Unknown: 5,640
Number of social workers by religion:
- Buddhism: 707
- Christianity: 42,336
- Hinduism: 817
- Islam: 3,808
- Judaism: 459
- none: 39,155
- other: 2,001
- prefer not to say: 7,363
- Sikhism: 841
- unknown: 5,374
Number of social workers by sexual orientation:
- bisexual: 2,397
- gay man: 1,326
- gay woman: 2,015
- heterosexual: 83,230
- prefer to self describe: 558
- prefer not to say: 7,955
- unknown: 5,380
Number of social workers when asked if their sex at birth was the same as their gender:
- yes: 87,498
- no: 6,447
- prefer not to say: 3,583
- unknown: 5,333
Top 10 most common nationalities of social workers:
- American: 398
- British: 92,606
- German: 333
- Indian: 653
- Irish: 1,023
- Nigerian: 623
- Polish: 371
- Romanian: 352
- South African: 644
- Zimbabwean: 2,327
Number of social workers by region:
- Midlands: 16,367
- Eastern: 8,676
- London: 16,521
- North East: 4,963
- North West: 13,854
- South East: 13,182
- South West: 8,370
- Yorkshire and the Humber: 9,857
- rest of UK: 447
- unknown: 10,624
Area of social work practice:
- Adult - hospital work: 3,038
- Adult - learning disabilities: 3,602
- Adult - mental health: 9,293
- Adult - older people: 7,342
- Adult - other: 9,402
- Adult - physical disabilities: 884
- Children in need and in protection: 21,531
- Children and families - other: 15,248
- Children with disabilities: 2,658
- Children's hospital social work: 177
- Children's mental health: 2,322
- Court services/CAFCASS: 1,873
- Criminal justice: 270
- Domestic abuse: 196
- Fostering, special guardianship and adoption, residential: 10,740
- Leaving care post 18+: 712
- Lecturer or other academic: 1,346
- Other specialist services: 4,956
- Substance misuse: 312
- Unaccompanied asylum seekers and refugees: 502
- Youth justice: 689
- Unknown: 5,768
As at 31 March 2025:
Total number of social workers on the register: 104,857
Number of social workers by age:
- aged 24 or under: 2,152
- aged 25 to 29: 8,384
- aged 30 to 34: 11,846
- aged 35 to 39: 14,652
- aged 40 to 44: 14,673
- aged 45 to 49: 13,407
- aged 50 to 54: 13,183
- aged 55 to 59: 12,434
- aged 60 or over: 14,126
Number of social workers by gender:
- female: 87,712
- male: 17,013
- prefer not to say: 70
- prefer to self describe: 62
Percentage of social workers who have and have not provided diversity data:
- 95% have given all 5 answers
- 96% have given at least 1 answer
- 4% have given no answers
Number of social workers by disability:
- yes: 9,618
- no: 83,791
- prefer not to say: 4,933
- unknown: 4,515
Number of social workers by ethnicity:
- African: 12,980
- Any other Asian background: 670
- Any other Black/African/Caribbean background: 991
- Any other ethnic group: 458
- Any other Mixed/Multiple ethnic background: 881
- Any other White background: 4,464
- Arab: 87
- Bangladeshi: 648
- Caribbean: 4,267
- Chinese: 318
- English/Welsh/Scottish/Northern Irish/British: 62,552
- Gypsy or Irish Traveller: 65
- Indian: 3,119
- Irish: 1,295
- Pakistani: 1,970
- Prefer not to say: 2,155
- White and Asian: 678
- White and Black African: 772
- White and Black Caribbean: 1,494
- Unknown: 4,993
Number of social workers by religion:
- Buddhism: 697
- Christianity: 43,607
- Hinduism: 858
- Islam: 4,132
- Judaism: 442
- none: 40,183
- other: 1,995
- prefer not to say: 7,368
- Sikhism: 852
- unknown: 4,723
Number of social workers by sexual orientation:
- bisexual: 2,574
- gay man: 1,342
- gay woman: 2,007
- heterosexual: 85,656
- prefer to self describe: 582
- prefer not to say: 7,966
- unknown: 4,730
Number of social workers when asked if their sex at birth was the same as their gender:
- yes: 89,926
- no: 6,735
- prefer not to say: 3,525
- unknown: 4,671
Top 10 most common nationalities of social workers:
- American: 405
- British: 93,681
- German: 326
- Indian: 743
- Irish: 1,021
- Nigerian: 895
- Polish: 386
- Romanian: 342
- South African: 700
- Zimbabwean: 2,665
Number of social workers by region:
- Midlands: 16,547
- Eastern: 8,830
- London: 16,885
- North East:5,049
- North West: 14,256
- South East: 13,051
- South West: 8,566
- Yorkshire and the Humber: 9,852
- rest of UK: 435
- unknown: 11,386
Area of social work practice:
- Adult - hospital work: 3,167
- Adult - learning disabilities: 3,679
- Adult - mental health: 9,552
- Adult - older people: 7,493
- Adult - other: 9,904
- Adult - physical disabilities: 894
- Children in need and in protection: 21,789
- Children and families - other: 15,913
- Children with disabilities: 2,726
- Children's hospital social work: 194
- Children's mental health: 2,446
- Court services/CAFCASS: 1,858
- Criminal justice: 290
- Domestic abuse: 208
- Fostering, special guardianship and adoption, residential: 10,921
- Leaving care post 18+: 734
- Lecturer or other academic: 1,341
- Other specialist services: 5.100
- Substance misuse: 315
- Unaccompanied asylum seekers and refugees: 554
- Youth justice: 679
- Unknown: 5,100